What I was communicating
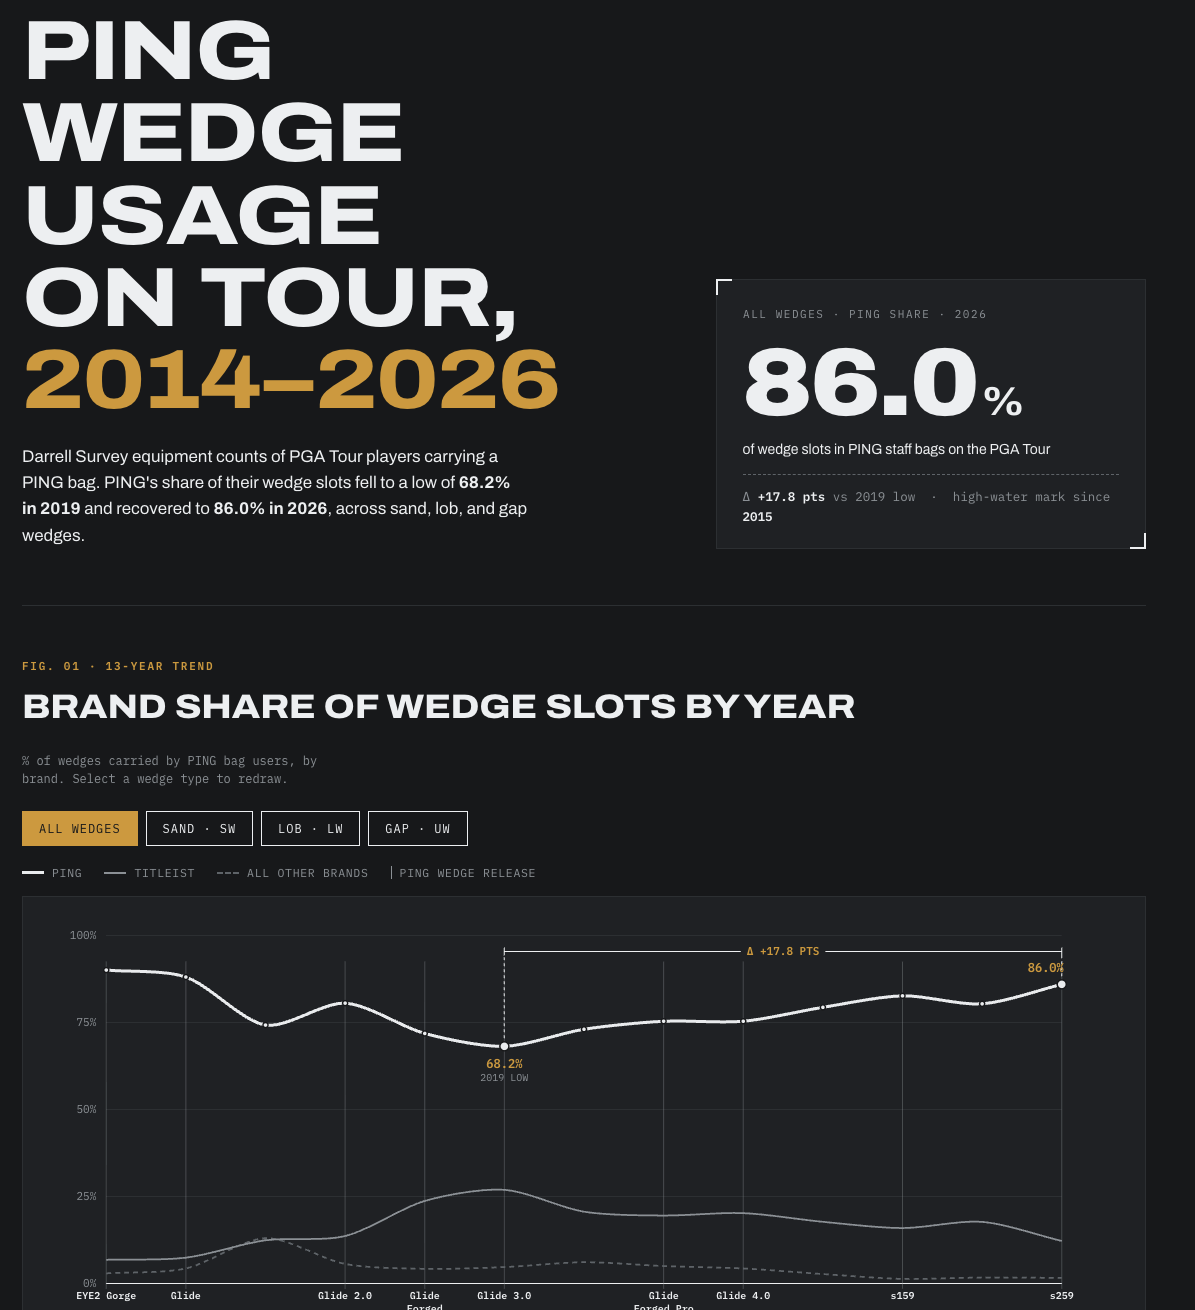
The visual tracks PING wedge-slot share across 2014–2026, highlights the 2019 low and the subsequent recovery, and provides wedge-slot context.
Stakeholder use
This visual was included in a mainstage International Sales Meeting presentation by John K.
Why it works
The hierarchy is intentionally aggressive: one dominant headline, one dominant trend, and only the annotations needed to understand the story.